Service provider report
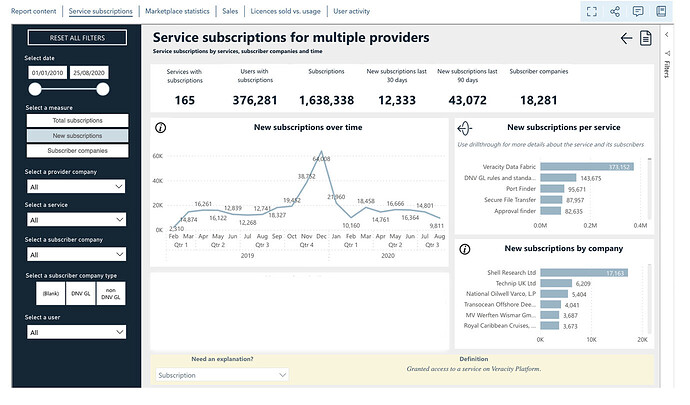
If you have a service on Veracity Marketplace, you can access the Service Provider Report.
The report enables you to easily track the service/services you have on the Marketplace, giving you data analytics through an easy-to-use dashboard.
With the Service Provider Report you’re able to;
- Keep an overview of your service subscriptions (filtering by users, companies, and time)
- See the number of page views over time, or by country, for your Marketplace page
- Monitor the sales you receive
- Monitor the licences sold vs usage (Beta version)
- Monitor the user activity (Beta version)
The service Provider Report
The registered owner of the service will automatically get access to the Service provider report. In order for others to get access the service provider can send a request to onboarding@veracity.com
Sales funnel visualization
Within our Veracity offerings, we also have a visualization of sales funnels in Google Data Studio.
Inside these reports, you, as a provider, can see data from the general purchase/access journey and analyse how many users:
- Visited your product page
- Contacted you through forms
- Started the checkout process or the get access to free product process;
- Have been converted as part of a marketing campaign.
Product page funnel in Google data studio
To get access to this please contact onboarding@veracity.com
User behaviour tracking
In addition to this, we also have instrumented our pages with Hotjar, to provide you with more insights.
Hotjar is a user-behaviour-tracking tool that provides heatmaps (colour data visualization) on how users clicked, scrolled and moved around on your product page.
Through anonymous recordings of visitor behaviour, it is possible to get an even deeper understanding of how users interact with your content. You can then use the aggregated statistics as a basis for testing assumptions and further design/content improvements.
Heatmap and interaction map in Hotjar. Contact Marcus Low Guang Xing if you are intrested.


